Research figures
Computed examples, method diagrams and editable sources for research figures.
The computed figures below use public synthetic data and released software. Each links to its assumptions, numerical checks and full multi-panel version. The method diagrams and constructed illustrations follow in separate sections.
Computed examples
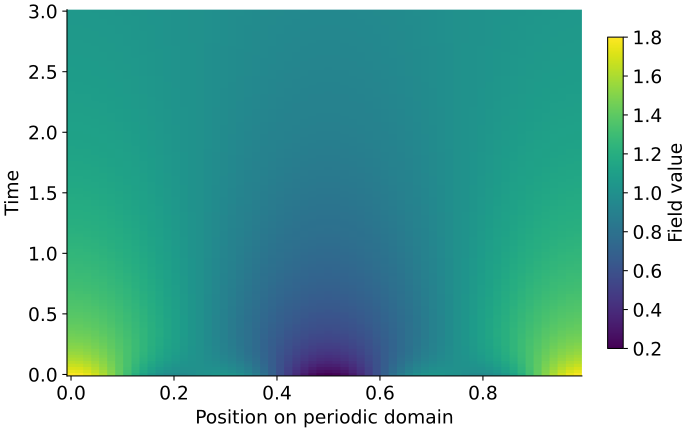
Spatial diffusion
A periodic field simulated with OP System and OP Engine, checked against its discrete Fourier-mode solution.
SVG · PDF
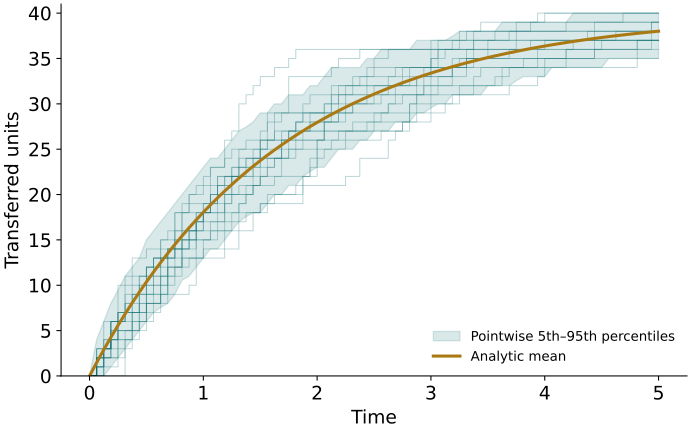
Stochastic transfers
Independent exact simulations with an analytic mean and final-distribution reference.
SVG · PDF
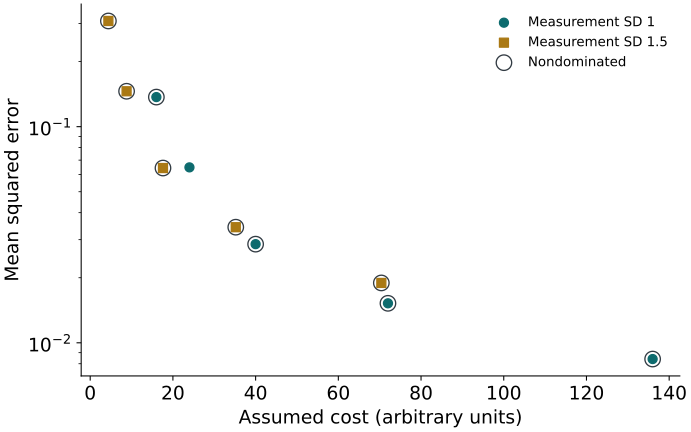
Replicated design comparison
Ten measurement designs compared on estimation error and assumed cost.
SVG · PDF
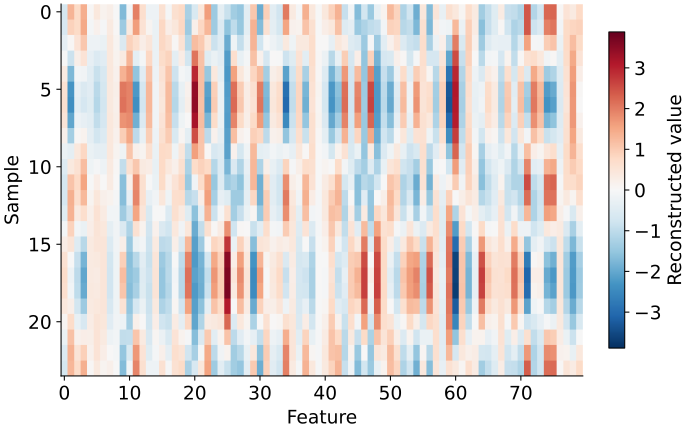
Incomplete-data reconstruction
A synthetic matrix reconstructed with VBPCApy and assessed on held-out entries.
SVG · PDF
Python source and pinned dependencies · Numerical data · CSV comparison table · Assumptions and checks
Method and software diagrams
TikZ sources accompany the SVG and PDF exports. Connections show relationships between components; they do not prescribe one execution order. Capability and qualification details remain in the corresponding package documentation.
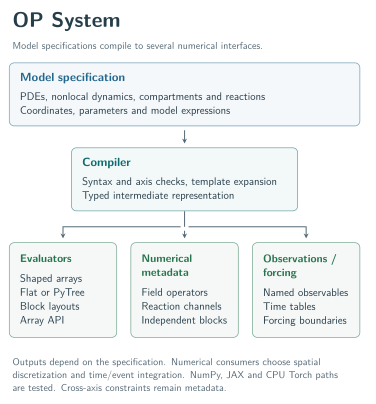
OP System
Model compilation and numerical interfaces.
SVG · PDF · TikZ source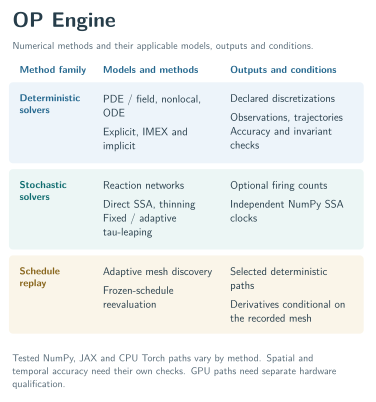
OP Engine
Deterministic, stochastic and replay method families.
SVG · PDF · TikZ source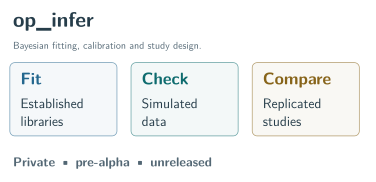
op_infer
Research capabilities for inference, calibration and design.
SVG · PDF · TikZ source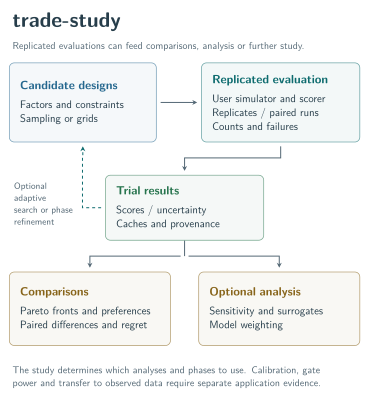
trade-study
Replicated design comparisons and optional analyses.
SVG · PDF · TikZ source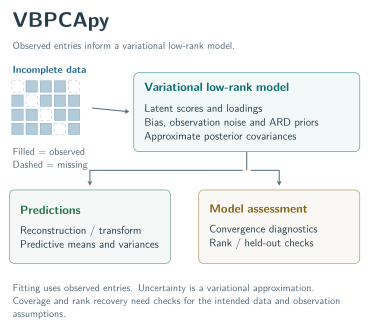
VBPCApy
Observed-data model and approximate uncertainty.
SVG · PDF · TikZ source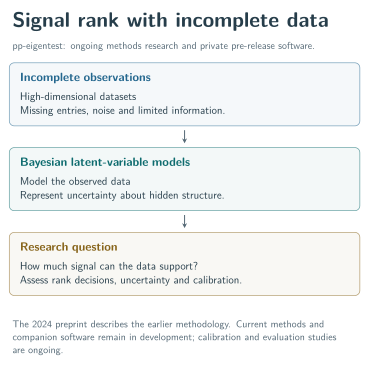
pp-eigentest
Signal-rank research for incomplete data.
SVG · PDF · TikZ source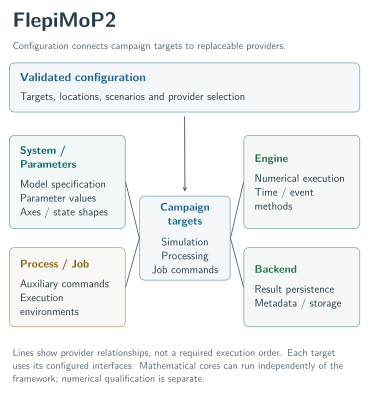
FlepiMoP2
Provider interfaces and campaign relationships.
SVG · PDF · TikZ source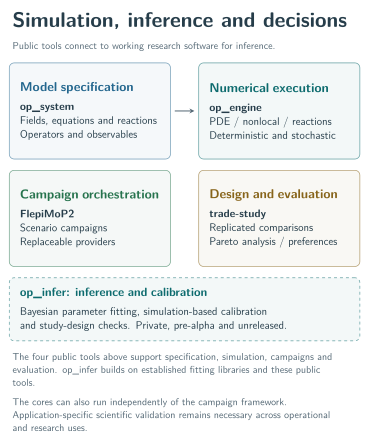
Simulation, inference and decisions
Relationships among methods and scientific applications.
SVG · PDF · TikZ source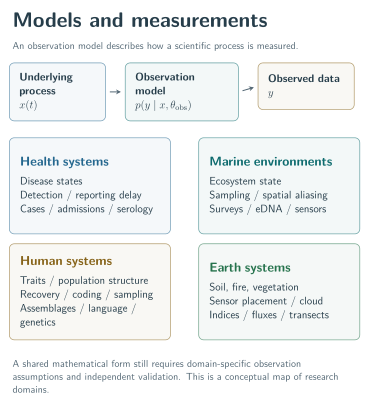
Models and measurements
Scientific processes, measurement assumptions and recorded data.
SVG · PDF · TikZ source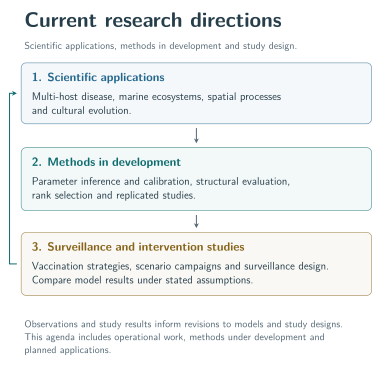
Current research directions
Methodological questions and application areas.
SVG · PDF · TikZ sourceConstructed illustrations
These figures use explicitly constructed examples rather than application results. They do not report empirical costs, information estimates or a predictive-score comparison.
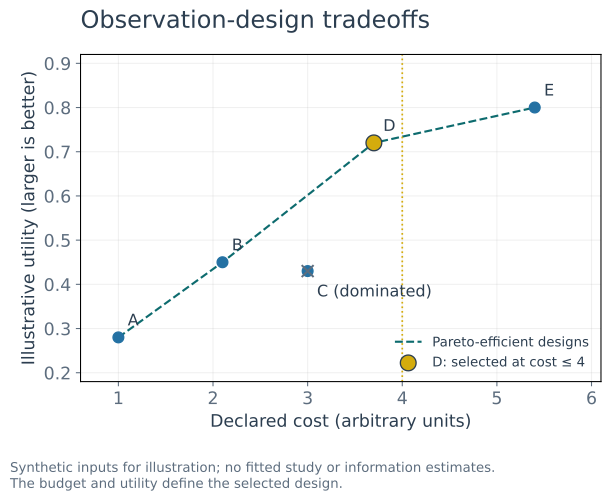
Observation-design tradeoffs
Constructed cost and utility values illustrate dominance and a stated budget.
SVG · PDF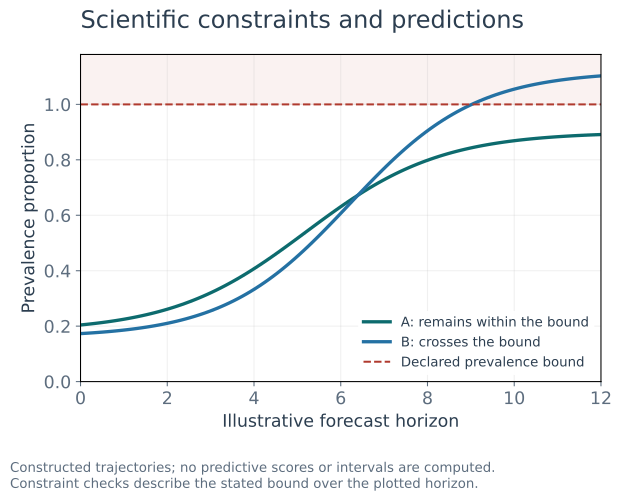
Constraint checks for predictions
Two constructed prevalence curves compared with a stated upper bound over the plotted horizon.
SVG · PDFPython source for constructed illustrations · Build and scope notes · Compact preview sources